
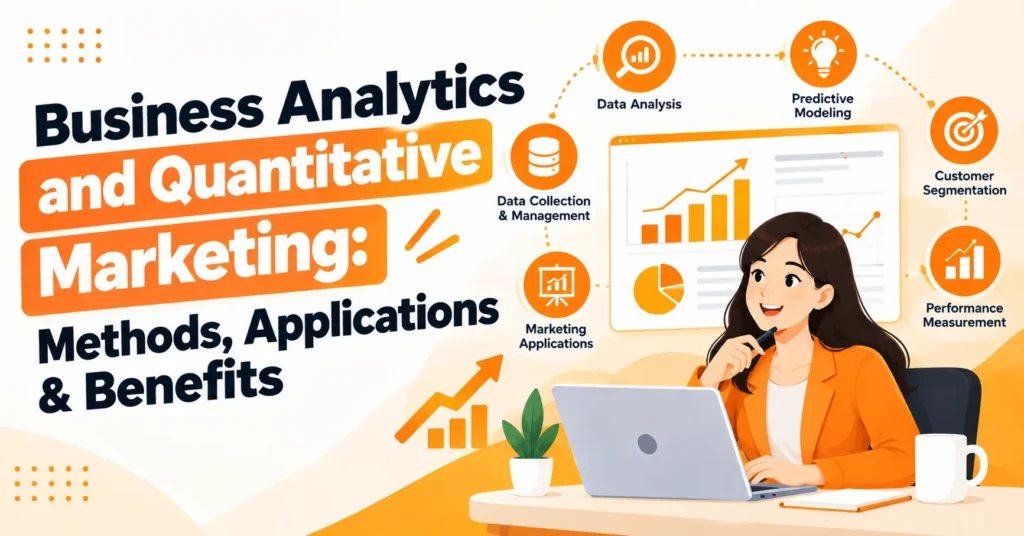
Businesses generate huge amounts of data, but collecting information is only the first step toward smarter decisions. Business analytics and quantitative marketing combine data, statistics, and marketing strategy to help companies understand customers, measure performance, and identify profitable opportunities.
Through predictive analytics, customer segmentation, statistical analysis, and data-driven marketing, organizations can turn complex datasets into practical insights. These methods support important decisions involving pricing, advertising, demand forecasting, customer retention, and business growth.
As competition becomes increasingly data-driven, companies need reliable analytical approaches to reduce uncertainty and improve results.
Understanding how quantitative methods connect marketing insights with wider business objectives can create stronger strategies and more measurable outcomes.
What Is Business Analytics and Quantitative Marketing?
Business analytics is the process of examining business data to discover patterns, evaluate performance, identify opportunities, and support decision-making. It can cover sales, finance, operations, supply chains, customer service, and strategic planning.
Quantitative marketing applies statistical and mathematical techniques to marketing problems. It uses measurable customer, market, campaign, and sales data to answer questions about demand, pricing, segmentation, advertising effectiveness, and customer behavior.
When combined, these disciplines create a data-driven approach that connects marketing activity with wider business outcomes.
Why Are Quantitative Analytics Important for Businesses?
Business decisions often involve uncertainty. A company may need to decide how much inventory to purchase, which customer segment to target, how much to spend on advertising, or whether a price change could affect demand.
Quantitative analysis provides evidence for these decisions. Instead of relying entirely on assumptions, businesses can use statistical analysis, forecasting models, and historical data to identify patterns and estimate potential outcomes.
The goal is not simply to produce complicated reports. The real objective is to transform data into useful insights that support measurable business decisions.
How Business Analytics and Quantitative Marketing Work Together?
Business analytics has a broad organizational focus, while quantitative marketing concentrates on customers, markets, products, and marketing activities. Their relationship becomes valuable when customer insights need to be connected with revenue and business performance.
For example, marketing analytics may identify a customer segment with high purchase frequency. Business analytics can then evaluate its profitability, lifetime value, operational requirements, and contribution to overall revenue.
This creates a complete analytical process: customer data → quantitative analysis → marketing insight → business decision → measurable outcome.
Key Components of Business Analytics
A successful analytics process usually begins with data collection and preparation. Information from CRM systems, websites, sales platforms, surveys, advertising channels, and transactions must be organized before reliable analysis can take place.
The next stages involve descriptive analytics, diagnostic analytics, predictive analytics, and prescriptive analytics. These approaches can explain past performance, identify causes, estimate future outcomes, and support decisions about what action should be taken.
What Is Quantitative Marketing?
Quantitative marketing uses numerical information to understand markets and customers. It can analyze purchasing patterns, customer preferences, campaign results, pricing behavior, conversion rates, and demand.
Quantitative marketing research can use surveys, transaction records, behavioral data, customer databases, experiments, and other measurable sources. Statistical techniques then turn these datasets into insights that marketers can use.
This approach is particularly useful when businesses need to compare customer groups, measure changes, test assumptions, or estimate the likely effect of a marketing decision.
Quantitative Methods Used in Business Analytics and Marketing
A range of mathematical and statistical methods can be used depending on the business question. Descriptive statistics summarize data, while inferential statistics help determine whether findings from a sample can provide meaningful conclusions.
Regression analysis can examine relationships between variables, while time-series analysis can identify trends and support forecasting. Multivariate analysis can evaluate multiple factors at the same time.
More advanced applications include econometrics, predictive modeling, data mining, clustering, optimization, machine learning, and experimental design. The best method depends on the data, objective, and decision being considered.
Regression Analysis for Business Decisions
Regression analysis is one of the most widely used quantitative techniques. It helps analysts examine how one variable may be associated with one or more other variables.
For example, a business could analyze how advertising expenditure, seasonality, pricing, and customer demand are related. The results can help analysts understand relationships and build models for prediction, although correlation alone does not automatically prove causation.
Regression can therefore support sales forecasting, pricing analytics, demand analysis, customer value modeling, and marketing performance analysis.
Predictive Analytics and Forecasting
Predictive analytics uses historical and current information to estimate future outcomes. Businesses can use it to forecast sales, demand, customer churn, purchasing behavior, or potential campaign results.
Time-series forecasting is especially useful when data changes over time. A retailer, for instance, can examine previous sales patterns to anticipate seasonal demand and make better inventory and marketing decisions.
Predictive models are estimates rather than guarantees. Their reliability depends heavily on data quality, model selection, assumptions, and how closely future conditions resemble the data used to build the model.
Customer Segmentation and Behavioral Analytics
Not every customer has the same needs, purchasing behavior, or commercial value. Customer segmentation uses measurable characteristics to divide audiences into meaningful groups.
Businesses can segment customers using demographics, purchasing frequency, spending patterns, engagement, product preferences, or other behavioral variables. Cluster analysis and other statistical approaches can help identify groups that may not be obvious from basic reporting.
These insights can support personalized messaging, product recommendations, retention strategies, audience targeting, and marketing budget allocation.
Pricing Analytics and Demand Forecasting
Pricing decisions directly affect revenue, demand, customer perception, and profitability. Quantitative methods can help businesses examine how customers respond to different prices and identify relationships between price and demand.
Demand forecasting adds another layer by estimating future purchasing levels. When pricing analytics and forecasting are combined, businesses can make more informed decisions about promotions, inventory, production, and marketing investment.
Marketing Analytics and Campaign Measurement
Marketing analytics examines whether marketing activity is contributing to desired business outcomes. It can connect campaign data with website behavior, leads, conversions, sales, and customer retention.
Important measures include conversion rate, customer acquisition cost, customer lifetime value, marketing ROI, return on ad spend, engagement, retention, and revenue contribution. Looking at several metrics together usually provides more context than relying on one number.
Business Analytics vs. Marketing Analytics
Business analytics covers a wider organizational scope, whereas marketing analytics concentrates on marketing activities and customer-related performance. The distinction is important, but the two areas frequently share data and analytical techniques.
| Factor | Business Analytics | Marketing Analytics |
| Primary focus | Overall business performance | Marketing and customer performance |
| Main questions | How can the business improve? | How can marketing perform better? |
| Typical data | Sales, finance, operations, inventory | Campaign, customer, website, advertising |
| Common methods | Forecasting, regression, optimization | Attribution, segmentation, experimentation |
| Typical metrics | Revenue, margin, costs, productivity | CAC, CLV, conversion rate, ROAS |
| Main users | Executives, analysts, finance, operations | Marketers, growth teams, brand managers |
| Main outcome | Business efficiency and strategic decisions | Marketing effectiveness and customer growth |
Marketing analytics can therefore be considered a specialized analytical area within the broader business environment. Both disciplines become more powerful when their findings are connected.
Business Analytics vs. Quantitative Marketing
The difference between business analytics and quantitative marketing mainly comes down to scope. Business analytics can investigate almost any organizational problem, from supply-chain efficiency to financial performance.
Quantitative marketing has a narrower focus on markets, consumers, products, pricing, promotions, and marketing decisions. However, the two share many methods, including statistics, regression, forecasting, predictive modeling, optimization, and data visualization.
A business may use quantitative marketing to identify which audience is most valuable and business analytics to determine whether pursuing that audience improves overall profitability.
Real-World Example of Quantitative Marketing
Consider an ecommerce company experiencing rising advertising costs. The marketing team has large amounts of campaign, customer, and sales data but does not know which audiences generate the strongest long-term value.
Analysts can segment customers based on purchasing behavior, calculate customer lifetime value, compare acquisition costs, and examine conversion patterns. Predictive models can then help identify audiences with stronger potential value.
The business can use those findings to adjust targeting, campaign budgets, retention efforts, and product offers. This demonstrates how quantitative analysis can move from raw data to a practical business decision.
From Raw Data to Actionable Insights
Collecting data is only the beginning. Data must first be cleaned, structured, validated, and interpreted before analytical conclusions can be trusted.
A useful workflow is to define the business question, identify relevant data, prepare the dataset, select an appropriate analytical method, interpret the results, and connect the findings to a measurable action.
This process prevents a common problem in analytics: producing attractive dashboards without answering an important business question.
Important Metrics in Quantitative Marketing
Different objectives require different metrics. Customer acquisition cost measures the average cost of gaining a customer, while customer lifetime value estimates the economic value associated with a customer over the relationship.
Conversion rate helps measure the percentage of users completing a desired action. Return on ad spend evaluates advertising revenue relative to advertising expenditure, while marketing ROI provides a broader view of marketing investment and return.
Businesses should avoid treating individual metrics as isolated answers. A campaign with a strong conversion rate, for example, may still be commercially weak if customers have low lifetime value or acquisition costs are excessive.
Tools Used for Business Analytics and Quantitative Marketing
Analytics professionals use different technologies depending on the size and complexity of the problem. Excel is useful for calculations, exploratory analysis, and smaller datasets, while SQL is widely used to retrieve and organize information from databases.
Python and R support statistical analysis, predictive modeling, automation, and machine learning. Business intelligence platforms such as Power BI and Tableau help transform analytical results into dashboards and visual reports.
Marketing teams may also work with web analytics platforms, CRM systems, customer data platforms, advertising tools, and marketing automation software. The technology matters, but the ability to select and interpret the right data matters more.
Skills Needed for Quantitative Marketing
A strong quantitative marketer needs more than marketing knowledge. Statistics, probability, data interpretation, analytical reasoning, and basic mathematics provide the foundation for understanding quantitative models.
Technical skills such as SQL, spreadsheets, Python, R, data visualization, and statistical software can increase analytical capability. At the same time, communication and business knowledge are essential for turning technical findings into understandable recommendations.
The most useful professionals can move between numbers and business questions without losing sight of the organization’s actual objectives.
Educational Background and Learning Path
People entering this field may come from business analytics, marketing analytics, statistics, economics, econometrics, mathematics, data science, computer science, or related business disciplines.
A practical learning path starts with statistics and data analysis before progressing to regression, forecasting, SQL, programming, visualization, predictive modeling, and machine learning. Marketing concepts such as segmentation, customer journeys, pricing, attribution, and campaign measurement can then be applied to these analytical skills.
Combining quantitative knowledge with business understanding can make analytical work more useful because the analyst understands not only how to calculate a result but also why that result matters.
Career Opportunities in Business Analytics and Quantitative Marketing
The growing use of data has created analytical roles across marketing, finance, operations, technology, retail, consulting, and other industries.
Potential career paths include business analyst, marketing analyst, data analyst, marketing data scientist, business intelligence analyst, customer analytics specialist, quantitative analyst, marketing analytics manager, and data science professional.
Job responsibilities vary by organization. Some roles emphasize statistical modeling and programming, while others focus more heavily on dashboards, market research, campaign measurement, forecasting, or strategic decision-making.
Benefits of Quantitative Analytics for Businesses
The major advantage of quantitative analysis is that it gives organizations a structured way to evaluate complex questions. Businesses can use data to improve customer targeting, forecast demand, evaluate marketing investments, identify inefficiencies, and understand performance.
It can also improve resource allocation. Instead of distributing budgets equally across products, audiences, or channels, organizations can use analytical evidence to identify areas that deserve closer attention.
The quality of the outcome still depends on the quality of the data and the analytical approach. Quantitative methods support decisions; they do not eliminate uncertainty.
Common Challenges and Pain Points
Poor data quality is one of the biggest obstacles. Duplicate records, missing values, inconsistent tracking, disconnected platforms, and incorrect measurement can create misleading results.
Marketing attribution is another difficult problem. A customer may interact with search, social media, email, content, direct traffic, and multiple advertisements before purchasing. Assigning the entire outcome to one channel can oversimplify the customer journey.
Businesses must also consider privacy, data governance, model bias, changing consumer behavior, and the risk of confusing correlation with causation.
How to Make Analytics More Reliable?
Start with a clearly defined business question rather than collecting data without a purpose. The question should identify what decision needs to be made and what evidence would help answer it.
Data should then be validated and analyzed with a method appropriate to the objective. Results should be tested where possible, assumptions should be documented, and findings should be communicated in simple business language.
Most importantly, analytical results should lead to measurable actions. A useful analysis is one that helps someone make a better decision, not simply one that produces a complicated model.
The Future of Business Analytics and Quantitative Marketing
Artificial intelligence and machine learning are changing how organizations analyze data. Automated modeling, predictive systems, natural language interfaces, and advanced customer analytics can process information at a scale that was previously difficult to manage.
However, technology does not remove the need for analytical judgment. Businesses still need people who can define meaningful questions, assess data quality, understand statistical limitations, interpret models, and connect insights with business objectives.
The future will increasingly involve a combination of automation and human expertise rather than technology operating independently of business strategy.
Conclusion
Business analytics and quantitative marketing connect statistics, data, customer insights, and business strategy to solve measurable problems. From regression and forecasting to segmentation, pricing, predictive analytics, and campaign measurement, quantitative methods help organizations turn complex information into actionable insights. When supported by accurate data, appropriate methods, and sound judgment, analytics becomes a powerful foundation for smarter marketing and better business decisions.
Frequently Asked Questions
What is business analytics and quantitative marketing?
Business analytics and quantitative marketing combine statistical analysis, mathematics, data science, and marketing knowledge to understand business and customer problems.
What is the difference between business analytics and quantitative marketing?
Business analytics has a broad focus that can include finance, operations, sales, supply chains, and strategy.
What quantitative methods are used in marketing?
Common methods include regression analysis, hypothesis testing, forecasting, econometrics, segmentation, statistical modeling, optimization, experimentation, predictive analytics, and machine learning.
How does quantitative marketing help businesses?
It can help businesses understand customer behavior, identify valuable segments, evaluate campaigns, forecast demand, optimize pricing, measure marketing performance, and allocate resources more effectively.
What is the role of statistics in business analytics?
Statistics provides the foundation for summarizing data, identifying relationships, testing assumptions, estimating outcomes, and evaluating uncertainty.

James Robert
James Robert is a seasoned Off-Page SEO expert specializing in strategic link building, digital outreach, and authority growth for businesses aiming to improve search visibility and rankings. With over five years of hands-on experience, he helps brands strengthen their online presence through high-quality backlinks, niche-relevant placements, and ethical SEO practices aligned with Google’s guidelines. James’s core specialties include guest posting, blogger outreach, niche edits, brand mentions, and backlink profile optimization. He is highly skilled at building relationships with authoritative publishers and executing scalable outreach campaigns that drive long-term organic growth. As a contributor to leading marketing platforms, James regularly shares actionable insights on off-page SEO strategies, link acquisition, and sustainable ranking improvements, helping businesses achieve consistent and measurable SEO success.